

 Previous page
Although magnesiowüstite (Mg,Fe)O is likely to be the most abundant non-silicate mineral in the lower mantle, no single crystal data for the elastic moduli cij of this solid solution have been published. In the Annual Report of 1998 we reported for the first time determination of the sound velocity in the [100] direction (= vp100) of magnesiowüstite single crystals with 5, 15, 27, 36, 56, 75% total iron, in addition to pure MgO and FeO samples. We have now determined the sound wave velocity in the [111] direction (= vp111) utilizing ultrasonic interferometry on the same single crystals. These data allow us to constrain the elastic anisotropy of this mineral solid solution.
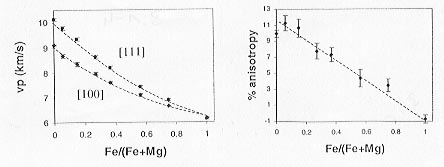
Figure 3.1-4 shows the composition-dependent longitudinal sound wave velocities of (Mg,Fe)O in [100] and [111] directions. The dashed lines represent polynomial fits to the data. The two lines come together at the FeO end-member, indicating that FeO exhibits little or no elastic anisotropy relative to pure MgO. Figure 3.1-5 depicts the p-wave anisotropy {100*(vp111 - vp100 ) /vp111 } as a function of composition. A linear curve has been fitted to the data (dashed line) excluding the value for pure MgO, which is significantly below the linear curve. The deviation of the periclase datum from the linear trend in Figure 3.1-5 may result from the non-stoichiometry due to the presence of ferric iron. Ferric iron, Fe3+, may occupy either the octahedral or tetrahedral positions in the B1 structure of (Mg,Fe)O. Moreover, to compensate the charge balance, one vacancy is created for the addition of every two ferric iron atoms. It is conceivable that in the case of low Fe-content, the defects are randomly distributed resulting in softening in the [100] direction. However, with increasing Fe-content the defects may form clusters and become preferentially aligned, causing a deviation from the rocksalt structure and softening in the [111] direction.
 |
|
Fig. 3.1-4: P-wave velocities at ambient conditions parallel to the [100] and [111] directions. The dashed lines represent polynomial fits to the data. |
Fig. 3.1-5: Anisotropy of P-wave velocities between the [111] and [100] directions. The dashed line is a linear fit to the data except MgO. |

Tel: +49-(0) 921 55 3700 / 3766, Fax: +49-(0) 921 55 3769, E-mail: bayerisches.geoinstitut(at)uni-bayreuth.de