

 Previous page
Perovskite sensu stricto, CaTiO3, is known to undergo a sequence of displacive phase transitions from cubic to orthorhombic with decreasing temperature. We have studied the inluence of iron and oxygen defect concentrations on the stability of these structures and, by means of strain analysis, resolved the order of the phase transitions. The technique employed was powder X-ray diffraction (XRD) at room temperature and at high temperatures.
The following sequence of space groups and transition compositions with increasing Fe content at room temperature is observed from the presence of superlattice reflections :
| x = 0.21(2) | x = 0.25(3) | |||
| Pbnm | -> | I4/mcm | -> | Pm3m |
Cell parameters were refined on the basis of these space groups. The splitting of the tetragonal peaks in the I4/mcm structure could not be resolved and the lattice parameters for samples with 0.205  x 0.251 were, therefore, refined with a = c (metrically cubic). Reduced lattice parameters for all the samples are plotted in Figure 3.2-8 showing the similarity of the values for the four annealing temperatures.
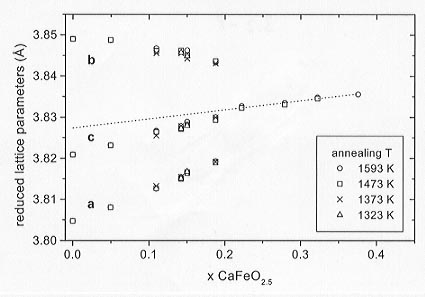 |
Fig. 3.2-8: Reduced lattice parameters of CaFexTi1-xO3-x/2. The broken line is the extrapolation for the cubic phases and defines the ao values for the calculation of the strains. |
In order to study the character of the displacive phase transitions we have analysed the behavior of a macroscopic property such as the change in the shape of the unit cell. This change in shape due to the phase transition is expressed in terms of the spontaneous strain. This quantity is always measured relative to the undistorted cell. Here, the components of the spontaneous strain are defined as: e1 = (a - a0)/a0, e2 = (b - a0)/a0 and e3 = (c - a0)/a0, where a, b and c are the lattice parameters of the orthorhombic phase and a0 is the lattice parameter that the cubic phase would have at the composition of the orthorhombic phases and is obtained by extrapolation of the cubic parameters. The degenerate symmetry-breaking strains are the orthorhombic distortion eo = e1 - e2 and the tetragonal distortion et = 1/ (3) (2e3 - e1 - e2). The symmetry-adapted form of the non-symmetry-breaking strain, ea, is defined as e a= e1 + e2 + e3.
The symmetry-adapted strains are plotted against x CaFeO2.5 in Figure 3.2-9. The evolution of et is continuous with composition for both annealing temperatures suggesting that the tetragonal to cubic transition is second order in character with a transition composition of x = 0.26 as indicated by the extrapolation to zero of the straight line fitted to the data. The transition composition is in agreement with the analysis of the superlattice reflections that placed this transition in the range x = 0.25 ± 0.03. The order of the transition also agrees with the one predicted by symmetry considerations. On the other hand, a straight line through the data for eo implies that the orthorhombic distortion would be equal to zero at x  0.42. However, the XRD diagrams of the samples with 0.279 x 0.376 indicate that the structure is cubic in this range. Therefore, eo must be discontinuous with increasing Fe content and the orthorhombic to tetragonal transition is first order in character, in agreement with the symmetry considerations.
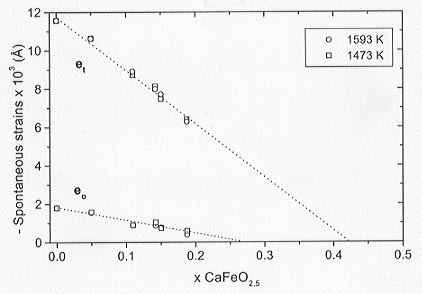 |
Fig. 3.2-9: Compositional evolution of the symmetry-adapted strains at room temperature for samples quenched from 1473 K and 1593 K. eo = orthorhombic distortion and et = tetragonal distortion. |
Samples with x = 0.109 and x = 0.188 studied by in-situ XRD at increasing temperatures showed the same sequence of phase transitions with the following transition temperatures :
| x = 0.109: | T (K) = 1273 ± 100 | T (K) = 1373 ± 100 | |||
| Pbnm | -> | I4/mcm | -> | Pm3m | |
| x = 0.188: | T (K) = 1073 ± 150 | T (K) = 1223 ± 150 |
Thus, the phases in the system CaFexTi1-xO3-x/2 that are orthorhombic or tetragonal at room temperature are actually cubic at the synthesis temperatures, but invert upon quenching. (cf. Fig. 3.2-5). Likewise, the transition temperatures shift towards lower values with increasing Fe content and a non-linear behavior seems to be suggested.

Tel: +49-(0) 921 55 3700 / 3766, Fax: +49-(0) 921 55 3769, E-mail: bayerisches.geoinstitut(at)uni-bayreuth.de