

 Previous page
Infrared spectra are a superposition of phonon signals from local parts of a sample. When a mineral is subjected to changes in temperature, pressure or composition, its vibrational spectrum invariably changes in some way. A particular band may change its frequency, intensity or line width. These effects can be used to monitor structural changes that take place on a local scale. The aim of this study is to analyse frequency shifts and variations in line width and intensity as a function of annealing temperature (corresponding to different structural states) and composition in the system CaTiO3-CaFeO2.5 We show how the resulting data prove the sensitivity of infrared spectroscopy to oxygen defect ordering in perovskites.
Effects of composition on the vibrational spectra of the phases in the system CaTiO3-CaFeO2.5 is shown in Figure 3.2-11. The number of vibrational modes in every spectrum is very high and it is therefore not straightforward to interpret all the observed signals or to make a precise assignment of all the IR modes. However, qualitative variations are evident in the spectra as changes in line width, absorption and frequency with composition and temperature.
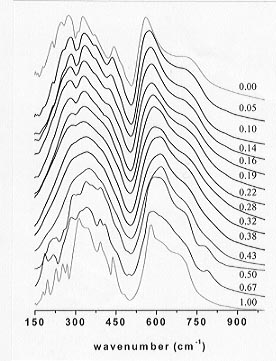 |
Fig. 3.2-11: IR powder spectra of CaTi1-x FexO3-x/2 perovskites annealed at 1320°C. Numbers in the right column give mole fractions of CaFeO2.5.
|
Instead of a conventional fitting, which would be impossible due to the many overlapping peaks, the autocorrelation function has been used to investigate line broadening. This method provides a statistical measure proportional to the average line width over a specified frequency range. The autocorrelation function is defined as:
 g(ω'+ω)g(ω')dω'
where Corr(g,ω) is a function of the lag, ω, which is the shift that is applied to the function relative to itself. The autocorrelation function was calculated for each spectrum after subtracting a linear background from the spectra in the region 135-500 cm-1. A Gaussian function of the form

was used to fit the central peak of the autocorrelation spectrum over different ranges of w from ω=±0.48 cm-1 to ω=±4.8 cm-1. Values of k2 were then plotted versus ω for each fit and the final value of the effective line width ( corr) taken as the value of k2 extrapolated linearly to ω = 0. Values of corr obtained by the autocorrelation of the IR spectra of every sample are plotted versus composition in Figure 3.2-12. It is a measure of the local strains in the structure. For every temperature, the line width increases with increasing Fe content, reaches a maximum and then decreases. The maximum occurs at a different composition for each temperature and
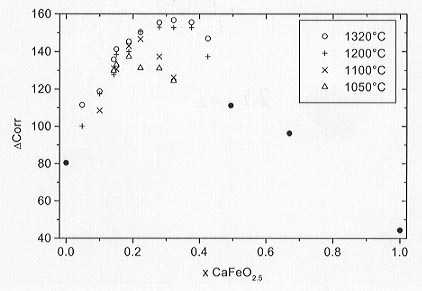 |
Fig. 3.2-12: Compositional and temperature variation of corr from autocorrelation analysis of the 135 - 500 cm-1 section of the spectra. |
coincides with the order-disorder boundary in the diagram of Figure 3.2-5. In the case of the samples annealed at 1320 and 1200°C the maximum is a plateau formed by the disordered cubic structures. It can also be seen that, for each composition, the line width increases with increasing annealing temperature. Thus, the order-disorder transition produces a decrease in bandwidths for the four series of temperatures analysed. The broadening in line width at intermediate compositions is interpreted as indicative of local heterogeneities in these samples with respect to the end-members, (i.e. the structure around each local cation configuration gives a slightly different phonon frequency), thus confirming our previous Mössbauer and TEM results that indicate a random distribution of the oxygen vacancies in this compositional range (see Becerro et al. Annual Report 98).
ABO3 cubic perovskite contains an optically inactive mode of symmetry F2u that becomes active by distortions of the lattice. This mode is located at 443 cm-1 in orthorhombic CaTiO3. In Figure 3.2-11 the band at 443 cm-1 is prominent in the spectrum of the CaTiO3 end-member and its intensity progressively decreases on increasing Fe content, being negligible to absent in the spectra corresponding to the cubic structures (0.28  x 0.38).
The frequency of the peak at around 600 cm-1 (Fig. 3.2-11) shifts systematically to higher values with increasing Fe content and to lower values again when going from the disordered and partially ordered structures to the fully ordered ones. However, the bands at 280, 335, 443 and 700 cm-1 shift to lower frequencies values with increasing Fe content in the spectra of the disordered structures. The shifting of these bands relates the microscopic behavior to the macroscopic property studied by a long-range order technique.

Tel: +49-(0) 921 55 3700 / 3766, Fax: +49-(0) 921 55 3769, E-mail: bayerisches.geoinstitut(at)uni-bayreuth.de