

 Previous page
The system CaTiO3-SrTiO3 offers a unique chance to study displacive phase transitions as a function of temperature and composition, because it shows complete solid solubility, and the CaTiO3 end member undergoes phase transitions at high (>1000°C) temperatures, whereas those in SrTiO3 occur below room temperature. We therefore determined, by means of in-situ X-ray powder diffraction and differential-scanning calorimetry, the structures and transition temperatures of two particularly relevant compositions (Ca0.6Sr0.4TiO3 and Ca0.8Sr0.2TiO3) and revised, in addition, the composition-dependent phase transitions at room temperature.
At room temperature, the CaTiO3 end member exhibits the orthorhombic space group Pbnm while the SrTiO3 end member is cubic with space group Pm3m. We have determined the different intermediate structures between Pbnm CaTiO3 and Pm3m SrTiO3 by examination of the superlattice reflections and the phase transitions have been located by the extrapolation of cell parameters. The sequence of space groups and transition compositions with increasing Sr content is:
| x ˜0.45(5) | x ˜ 0.65(5) | x ˜ 0.92(2) | ||||
| Pbnm | -> | Bmmb | -> | I4/mcm | -> | Pm3m |
The sample with x = 0.4 shows this same sequence of phase transitions as a function of temperature while in the case of the Ca0.8Sr0.2TiO3 perovskite it was not possible to determine the Pbnm - Bmmb transition due to a poorer resolution of the diagrams. The transition temperatures (in °C) for both compositions are:
| x = 0.40 | 375(25) | 525(25) | 800(50) | ||||
| Pbnm | -> | Bmmb | -> | I4/mcm | -> | Pm3m | |
| x = 0.20 | 875(25) | 1100(50) |
The variation of the cell parameters with temperature for x = 0.40 is plotted, reduced to those of a pseudo-cubic cell, in Figure 3.2-13.
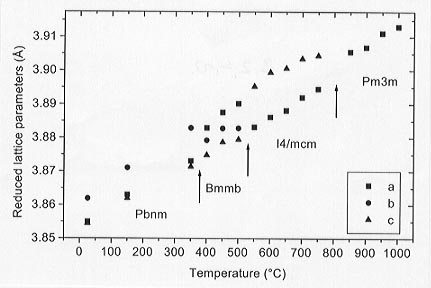 |
Fig. 3.2-13: Reduced lattice parameters of Ca0.6Sr0.4TiO3 perovskite with increasing temperature. |
Precise transition temperatures are best obtained from calorimetry measurements. The heat capacity curves of the samples with 0  x 0.65 show two peaks that shift toward lower temperature with increasing Sr content. These calorimetric peaks are assigned, in accordance with the transition temperatures obtained in the high temperature XRD study, to the transitions Bmmb -> I4/mcm and I4/mcm -> Pm3m. The calorimetric data do not show therefore the Pbnm -> Bmmb transition, suggesting that this transition has a very minor enthalpy change. The heat capacity curves of the samples with x > 0.65 only show one peak corresponding to the tetragonal to cubic transition, because for these compositions the orthorhombic to tetragonal transition occurs at temperatures below 0°C.
Figure 3.2-14 shows the temperature vs. composition phase diagram of the system CaTiO3-SrTiO3 where the transition temperatures obtained from the calorimetric and room temperature XRD studies have been plotted. The lines are linear fits of the DSC data corresponding to the Bmmb -> I4/mcm and I4/mcm -> Pm3m transitions for x > 0.1. The phase boundaries shift linearly towards lower Sr contents with increasing temperature and the Bmmb -I4/mcm and I4/mcm-Pm3m phase transitions in CaTiO3 lie very close to the linear trends in the T-x diagram. This implies that the plateau effect is negligible in this system, or, in other words, that the strain field associated with the substitution of Sr for Ca is large so that it affects the cooperative phenomenon of the displacive phase transitions even at very low concentrations of Sr.
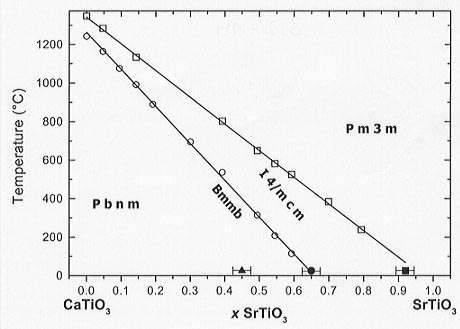 |
Fig. 3.2-14: Phase boundaries as a function of temperature and composition in the system CaTiO3-SrTiO3. Open symbols: DSC data, solid symbols: XRD at room temperature. |

Tel: +49-(0) 921 55 3700 / 3766, Fax: +49-(0) 921 55 3769, E-mail: bayerisches.geoinstitut(at)uni-bayreuth.de