
Characterization of silicon coordination in high-pressure minerals and glasses is often problematic because of the small size of samples from high pressure experiments and the fine-grained nature of polycrystalline and often polyphase aggregates. In the present study we show that Extended Energy-Loss Fine Structure (EXELFS) and Energy-Loss Near Edge Structure (ELNES) can be used to quantitatively determine the Si coordination and average Si-O bond lengths in minerals and amorphous phases. Whereas ELNES allows the investigation of the local electronic structure and bonding of a species in a material through the fine structure of an absorption edge, EXELFS provides a measure of the radial distribution function (average bond lengths, coordination number and Debye-Waller factor) from the oscillations in the EELS spectrum from 50 to several 100 eV above the ionization edge. EXELFS, like ELNES, can be performed using a transmission electron microscope and therefore has the advantage of high spatial resolution. One problem with TEM investigations of unstable high-pressure minerals is that they commonly become amorphous as a result of electron irradiation. We have investigated this amorphization process in stishovite using both ELNES and EXELFS to determine how the coordination of the Si sites change during amorphization.
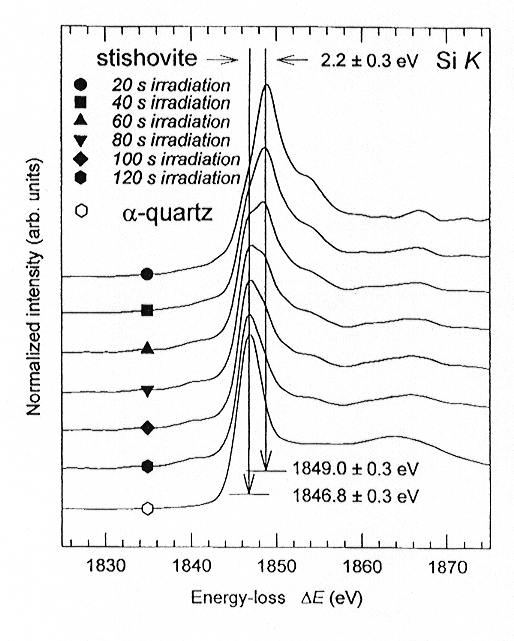
Amorphization of stishovite is readily followed by the changes in the Si K-edge ELNES while collecting an irradiation-dependent series of spectra (Fig. 3.3-6). The upper stishovite spectrum (20 s irradiation) displays a maximum at 1849.0 eV ± 0.3 eV with a small shoulder at 1853.3 eV ± 0.3 eV. An additional small shoulder can be observed in this spectrum at approximately 1846.8 eV ± 0.3 eV, which has not been seen in the calculated or experimental ELNES spectra (see Annual Report 1995). This shoulder marks the onset of stishovite amorphization. With increasing irradiation this shoulder becomes more intense whereas the primary stishovite peak decreases in intensity until nearly all of the intensity in the primary peak is transferred to the lower-energy peak (120 s irradiation). For comparison, the Si K-edge of a -quartz is displayed in Fig. 3.3-6. It can be seen that the primary Si K-edge peak for a -quartz, which corresponds to tetrahedrally coordinated Si, occurs at the same energy as the growing peak in the amorphization process which involves a change from sixfold to fourfold coordination of Si.
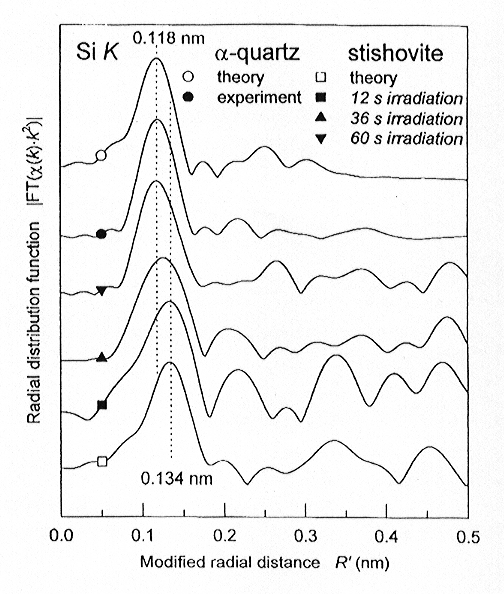
From the Fourier-transform of the oscillations in the EEL spectra, radial
distribution the irradiated stishovite, indicating that the functions (RDFs)
were calculated for a -quartz and the time-dependent
sequence of stishovite spectra (Fig. 3.3-7).
For comparison, theoretical RDFs for a -quartz
and stishovite are also shown. The experimental RDFs of stishovite (12
s irradiation) and of a -quartz display
very intense peaks at modified radial distances of R'st = 0.134
nm and R'qu = 0.118 nm corresponding to the 6 and 4 nearest oxygen
neighbours located at a mean Si-O bond distances of Rst = 0.1775
nm and Rqu = 0.1609 nm, respectively. The corresponding theoretical
RDFs of both SiO2 polymorphs are in perfect agreement in peak
position and intensity with the experimental RDFs. With increasing irradiation
time, the amorphization process of stishovite causes a shift of the first-shell
peak of the RDFs (Fig. 3.3-7) to R' = 0.126 nm (36 s irradiation)
and R' = 0.118 nm (60 s irradiation). Accompanying this shift
is a decrease in the peak intensity until R' reaches 0.118 nm (60
s irradiation), when the intensity increases again.
 |
Fig. 3.3-6: High-resolution Si K-edge ELNES spectra of stishovite as a function of electron irradiation dose (20 s, 40 s, 60 s, 80 s, 100 s and 120 s irradiation) and of a -quartz in the energy-loss range between 1825 eV and 1875 eV. The main peaks for stishovite and a -quartz are located at 1849.0 eV and 1846.8 eV, respectively (indicated by vertical lines). |
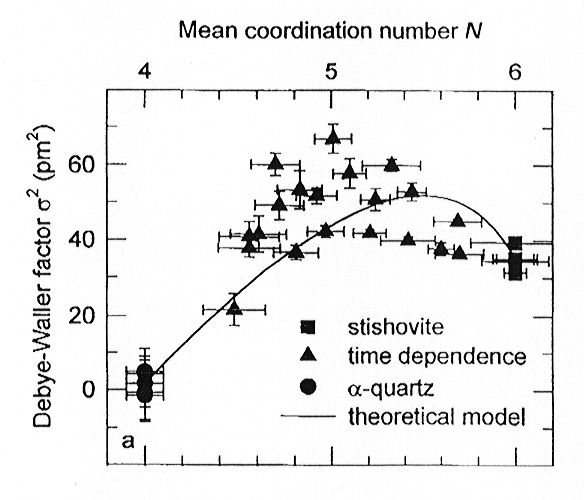
From the RDF data, values of mean coordination
number N, mean bond length R, and Debye-Waller factor (s2) can
be determined. The Debye-Waller factor of Si, as a function of mean coordination
number (Fig. 3.3-8), describes the structural disorder of the atomic environment
of Si during the amorphization process. We find that there is a maximum
in the s2 values at approximately N  5, indicating a maximum disorder of the Si environment in the partially
transformed phase rather than in the completely amorphous material. If
the disorder were simply a result of mixed octahedrally and tetrahedrally
coordinated Si, we would expect s2(N) to be a linear
combination of s2st and s2qu. Thus,
the peak in s2(N) occurring at a mean coordination number
N
  5 indicates that there is an
intermediate structural state of Si between sixfold and fourfold coordination
that probably involves fivefold-coordinated Si similar to that found in
CaSi2O5 (see Sections 3.3a and 3.3b).
 |
Fig. 3.3-7: The radial distribution function for the Si K-edges of theoretical calculated curved-wave multiple-scattering (49 and 193 atom clusters for a -quartz and stishovite, respectively) and of experimental a -quartz and stishovite (12 s, 36 s and 60 s irradiation) spectra. For a -quartz and stishovite (12 s irradiation), the peaks are located at modified radial distances of R' = 0.118 nm and R' = 0.134 nm (indicated by the vertical dotted lines), respectively. The error of the theoretical calculated and experimental peak positions is less than 0.001 nm. |
 |
Fig. 3.3-8: Debye-Waller factors s2 for stishovite (squares), a -quartz (circles) and the time-dependent stishovite series (triangles) as a function of the mean coordination number N. |

Tel: +49-(0) 921 55 3700 / 3766, Fax: +49-(0) 921 55 3769, E-mail: bayerisches.geoinstitut(at)uni-bayreuth.de
 Previous page